The 10th GrafanaCon was in Seattle last week and it was awesome! It was my first time attending GrafanaCon and really any conference of notable size. The conference was awesome and full of great speakers. The experts booth and Birds of a Feather sessions were helpful too for talking to people working on Grafana’s products.
There were lots of interesting announcements and talks. Below is a smorgasbord of what I found interesting and took notes on.
Mimir
Mimir 3.0 is due to be released later this year. When exactly? They’re keeping it under wraps for now but expect it sometime this fall.
Perhaps the biggest change is that it now requires running Kafka (or a Kafka compatible API) for ingest storage. Kafka enables Mimir 3 to separate the read and write paths. Grafana Cloud uses WarpStream for Kafka. Using object store is a common theme for Grafana and most of their products seem to be coalescing on using it. Interestingly, due to using Kafka, HA Mimir 3.0 only requires running two partitions, whereas Mimir 2 requires three. CAP thereom broken? No, just pushed into Kafka. Grafana claims Mimir 3 will be up to ~15% cheaper due to running one less partition, even when adding in Kafka.
Another change coming in Mimir 3 is the Mimir query engine. Mimir 2 uses the Prometheus query engine, which must pull in all the data in a query before performing calculations. The new Mimir query engine “works on streams of servers”. This leads to more consistent memory and CPU usage. Way less spikey. One statistic was a memory reduction of 92%, from 954 MB to 75.

New Mimir architecture, from the above Grafana Labs blog link
Beyla
Beyla uses eBPF to auto-instrument basically anything (your code, someone else’s code, a binary, etc.). It’s described as a “protocol tool”, meaning your language or framework does not need to have a telemetry SDK to use it. Current supported protocols include HTTP, gRPC, Kafka, and more. NATS is not yet supported, but the NATS to Kafka bridge might help for testing it with NATS. I am interesting in testing Beyla with NATS micro services to see what telemetery you can get for free.
I had a chance to speak with Nikola Grcevski at the experts booth. The Beyla codebase is composed of mostly Go and C. He said to add support for a new protocol only requires writing Go — very nice! He also said that if existing OpenTelemetry semantic conventions exist for a new protocol, that is what Beyla would use. I haven’t found one for NATS specifically, but there is one for messaging systems. Finally, he recommended using Colima for using/developing Beyla on macOS.
This episode of the Big Tent Podcast explains eBPF and Beyla in more detail: How eBPF Makes Observability Awesome.
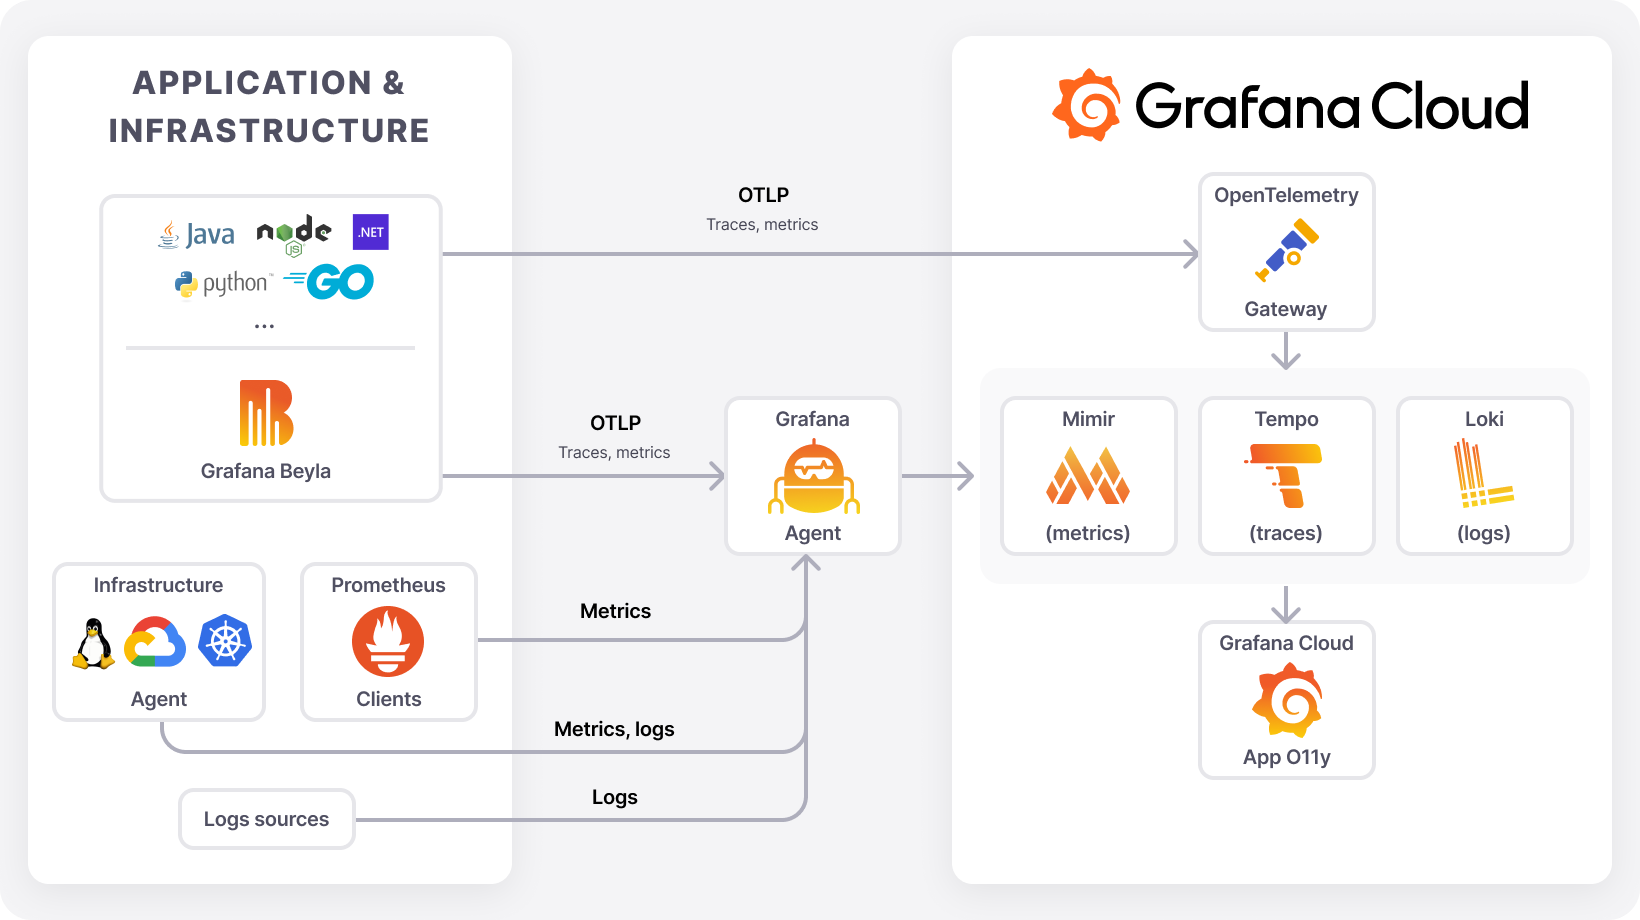
Beyla diagram from Grafana Labs
Tempo
Tempo is Grafana’s tracing backend.
You can run Grafana’s LGTM stack locally in a single docker container using docker-otel-lgtm:
docker run -p 3000:3000 -p 4317:4317 -p 4318:4318 --rm -ti -e ENABLE_LOGS_TEMPO=true grafana/otel-lgtm
My goal is to do some simple NATS micro service instrumentation using OpenTelemetry tracing with Tempo and compare this to what Beyla could do using the NATS protocol automatically. I spoke with Marty Disibio at the Birds of a Feather on Grafana storage engines. He showed some cool stuff around Telemetry drilldown, which helped make click in my head why drilldown is so cool — you don’t need to write any query language! The service graph view in Tempo looks like something I would want to use if I had a bunch of NATS micro services.

Tempo service graphs UI from Grafana Labs
Faro
Faro is Grafana’s front-end telemetry solution. I’m curious how it compares to Posthog, Statsig, and similar tools.
Grafana Plugins
It would be cool to have a Grafana plugin for interacting with a NATS micro service. I’d like to see a panel for seeing the results of pinging a NATS micro over time, using it’s PING endpoint.
Volkov Labs was mentioned several times for having great plugins.